Most Twitter users are tracking the wrong metrics. They obsess over follower counts and viral moments while ignoring the data that actually predicts long-term growth.
In 2026, Twitter analytics has become more sophisticated—yet more confusing. With X Premium now gating the full analytics dashboard and algorithm changes reshaping what works, understanding which metrics matter isn't just helpful. It's essential.
This guide cuts through the noise to show you exactly which Twitter analytics to track, why they matter, and how to use them to grow your presence on X. Whether you're a solopreneur, content creator, or marketing team, you'll learn to turn raw data into actionable growth strategies.
Why Most People Look at the Wrong Metrics
Here's the uncomfortable truth: vanity metrics feel good but rarely translate to real growth.
You've probably experienced this yourself. A tweet goes viral, your follower count spikes by a few hundred, and you're riding high. Two weeks later, those new followers aren't engaging with your content. Your engagement rate actually drops because you're reaching people who never cared about your niche in the first place.
The problem isn't the viral moment—it's what you're measuring. Too many creators focus on surface-level numbers like total impressions or follower count without understanding the context behind them. A tweet with 50,000 impressions and 1% engagement rate (500 interactions) is actually less valuable than one with 10,000 impressions and 5% engagement (also 500 interactions). The second tweet is resonating five times more effectively with its audience.
The Twitter algorithm in 2026 prioritizes engagement quality over raw reach. This means tracking the right metrics isn't just about feeling good about your numbers—it's about understanding what the platform rewards and optimizing accordingly.
The Metrics That Actually Matter
Engagement Rate: Your North Star Metric
Engagement rate is the single most important Twitter metric to track. While follower counts and impressions might stroke your ego, engagement rate tells you the truth about how your content performs.
The formula is simple: total engagements (likes, retweets, replies, clicks) divided by impressions, multiplied by 100. If your tweet received 200 engagements from 10,000 impressions, that's a 2% engagement rate. According to 2026 benchmarks, anything above 1.6% puts you ahead of the average Twitter account, while rates above 3% indicate truly compelling content.
Why does engagement rate matter so much? Because it measures resonance, not just reach. The Twitter algorithm notices when people interact with your content and shows it to more users. High engagement rates create a virtuous cycle: better engagement leads to more reach, which leads to more potential engagement.
Different methods exist for calculating engagement rate, but the most actionable approach divides all interactions by impressions. This gives you a complete picture of how effectively your content converts views into actions. For competitor analysis where you can't see impressions, divide public interactions (likes and retweets) by follower count instead.
Click-Through Rate: Converting Interest Into Action
While engagement rate measures overall resonance, click-through rate (CTR) reveals how effectively you drive specific actions. This metric matters most for tweets with external links—blog posts, product pages, landing pages, or resources.
The average organic CTR on Twitter hovers between 0.5% and 1.5%, while promoted tweets achieve 1-3%. These numbers might seem low, but remember: you're competing for attention in a feed designed to keep people scrolling. A 2% CTR on organic content is genuinely impressive.
Calculate CTR by dividing link clicks by impressions. If 150 people clicked your blog post link from 10,000 impressions, that's a 1.5% CTR—right in line with strong performance.
What separates high-CTR tweets from average ones? Compelling hooks that create curiosity gaps. Strong CTR requires making people want to click, not just like. This means your tweet copy needs to tease value without giving everything away, use specific numbers or outcomes, and create urgency or FOMO where appropriate.
Follower Growth Rate: Measuring Sustainable Momentum
Raw follower counts mislead more than they inform. Gaining 500 followers sounds impressive until you realize you're also losing 300 per week. Follower growth rate measures net change over time, revealing whether your account has genuine momentum.
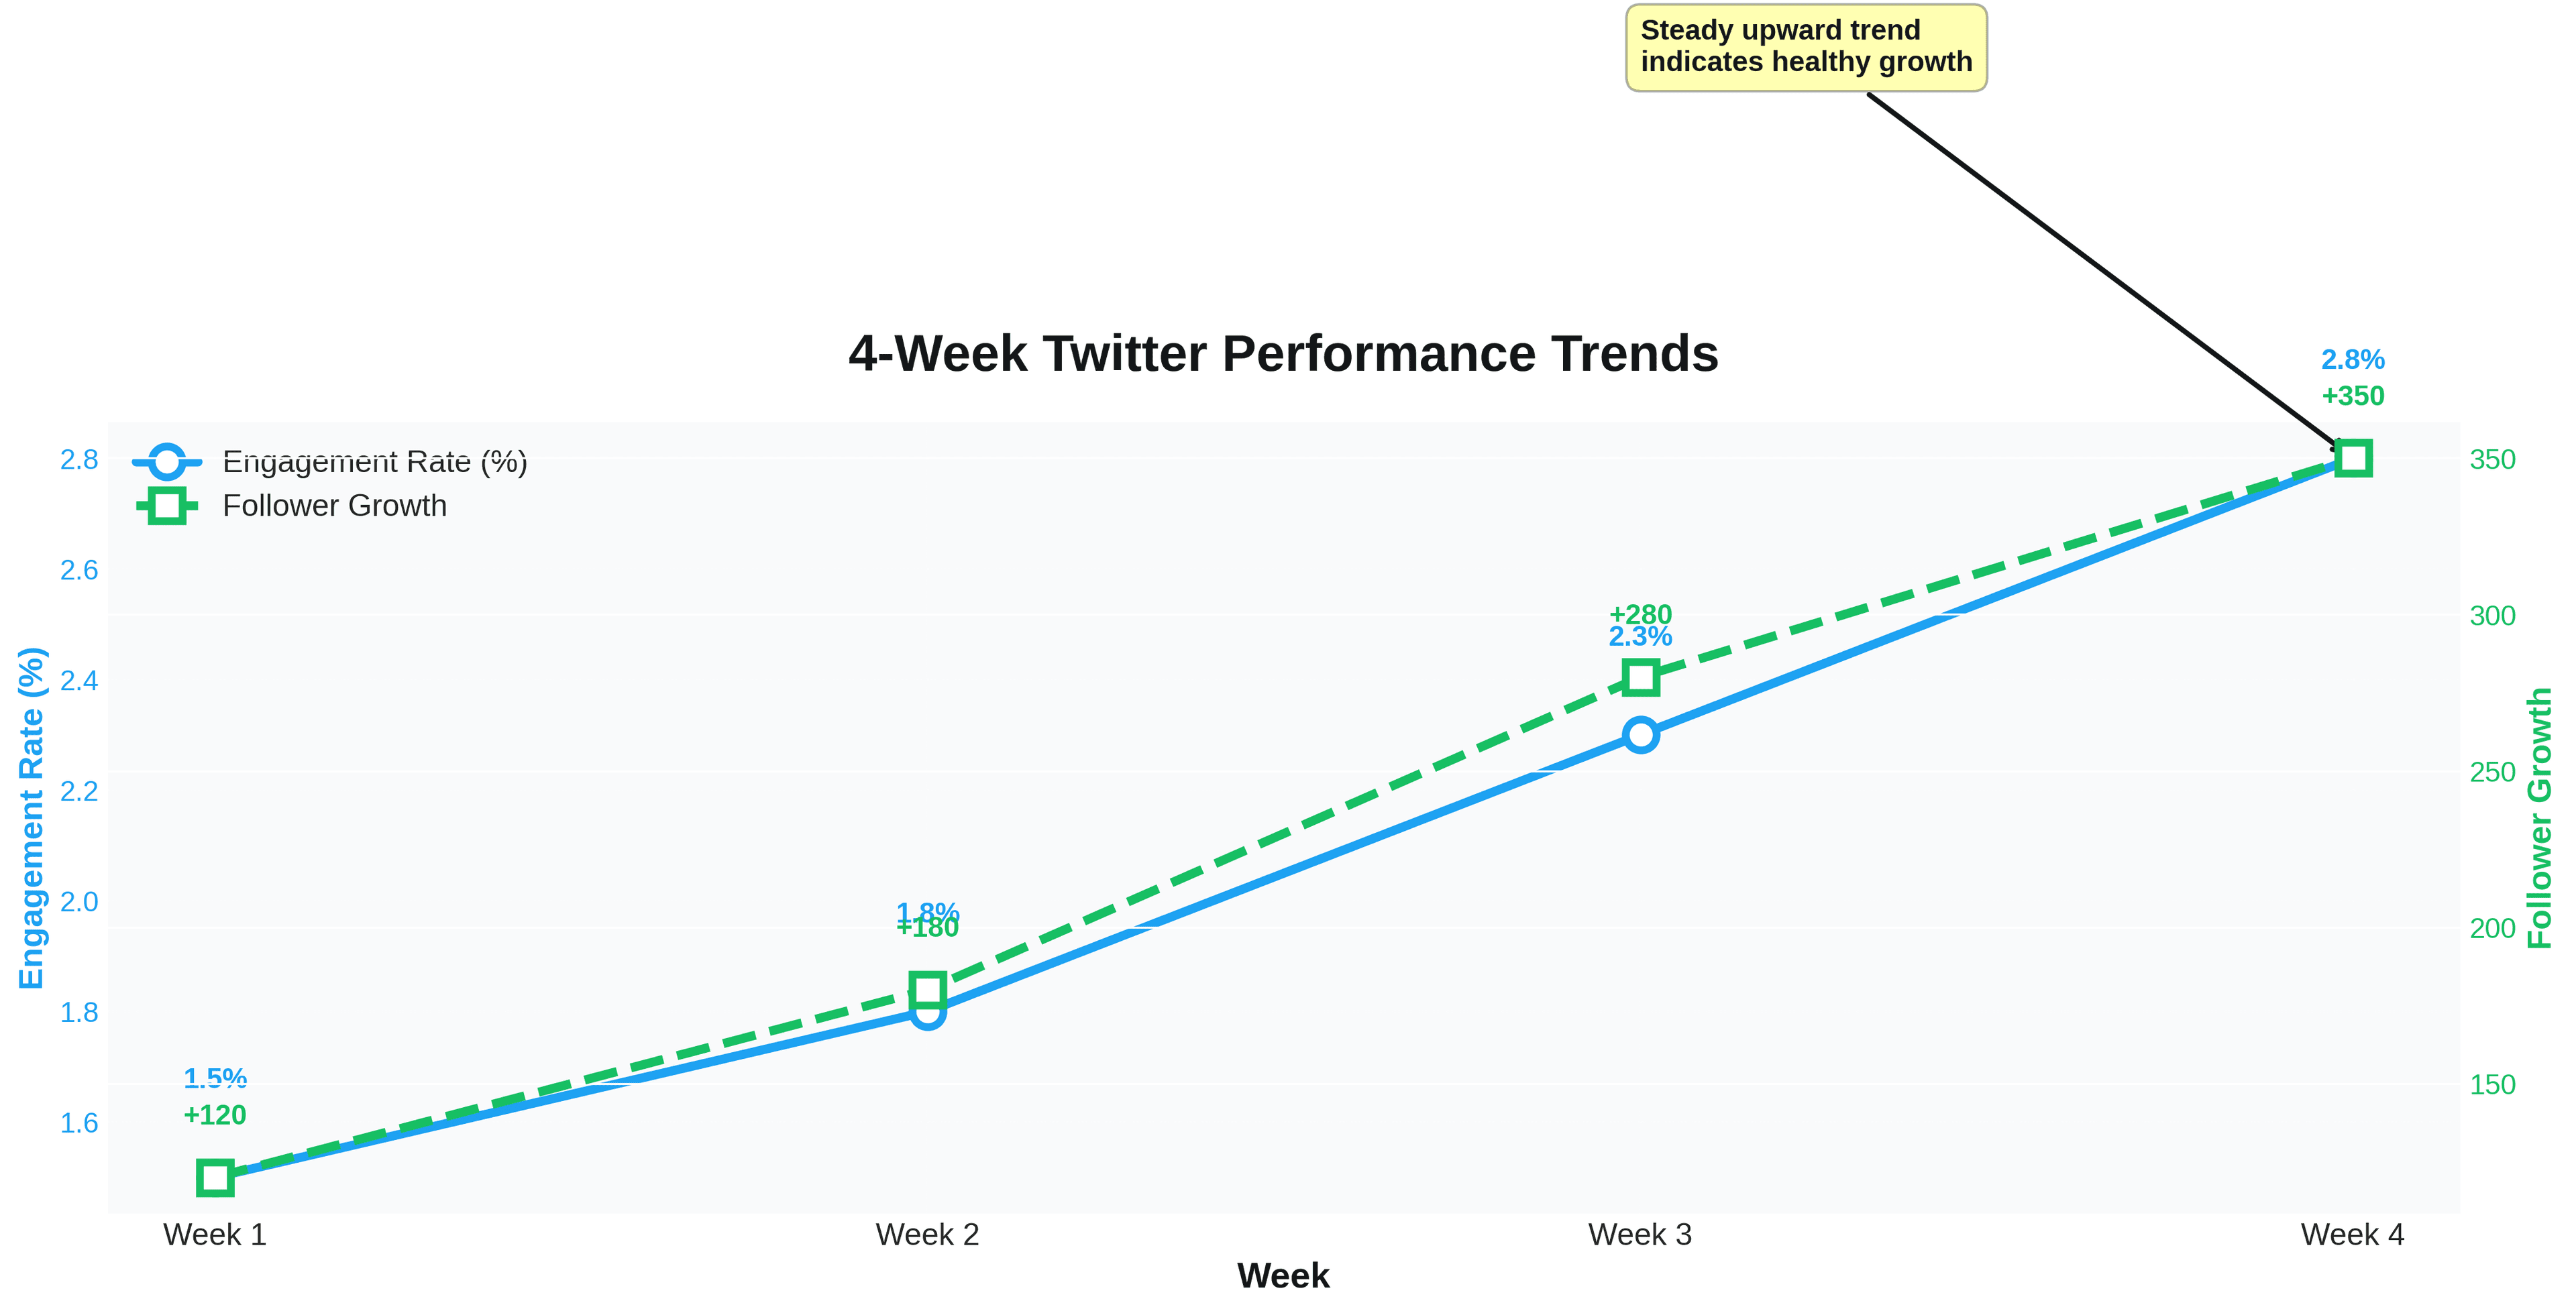
Calculate it as: (followers at period end – followers at period start) divided by starting followers. If you started January with 5,000 followers and ended with 5,300, your monthly growth rate is 6%. Industry benchmarks suggest 2-5% monthly growth indicates healthy, sustainable expansion for established accounts.
Follower growth rate connects directly to content quality and consistency. Sporadic posting creates sporadic growth. Accounts that post valuable content on a predictable schedule see steadier follower increases because new audience members discover them through consistent visibility.
Pay attention to correlation between specific content types and follower spikes. When you notice certain topics or formats driving new followers, double down. The goal isn't just growing your audience—it's attracting the right audience who will engage long-term.
Impressions vs. Reach: Understanding True Visibility
Impressions and reach might sound similar, but they measure different things. Impressions count every time your tweet appears on someone's screen. If one person scrolls past your tweet three times, that's three impressions. Reach (not directly tracked by Twitter but approximated through analytics tools) counts unique users who saw your content.
For active Twitter accounts, the benchmark is 50,000-200,000 organic impressions monthly. However, impressions without context are meaningless. A tweet with 100,000 impressions but only 500 engagements (0.5% engagement rate) underperforms one with 20,000 impressions and 1,000 engagements (5% engagement rate).
The impressions-to-engagement ratio reveals content quality. High impressions with low engagement suggest your content reached many people who didn't care. Lower impressions with high engagement indicate you're creating content that deeply resonates with your target audience—exactly what the algorithm rewards.
Track impressions over time to identify patterns. Tweets that gain steady impressions over weeks rather than spiking and dying often indicate strong SEO optimization and lasting value. These "evergreen" tweets continue attracting views long after posting, contributing to sustained growth.
Understanding the Twitter/X Algorithm in 2026
The Twitter algorithm has evolved significantly from its chronological timeline days. In 2026, understanding algorithmic priorities is non-negotiable for growth.
The current algorithm evaluates several signals when deciding which tweets to amplify: engagement velocity (how quickly people interact after posting), engagement depth (replies and retweets weighted more than likes), relationship strength (interactions with accounts you frequently engage with), and content freshness (recent tweets favored but not exclusively).
One critical algorithmic shift: the platform now rewards sustained engagement over viral spikes. Tweets that generate steady interaction over 48-72 hours perform better long-term than those with immediate engagement that quickly fades. This means posting when your audience is most active matters less than creating content that encourages ongoing conversation.
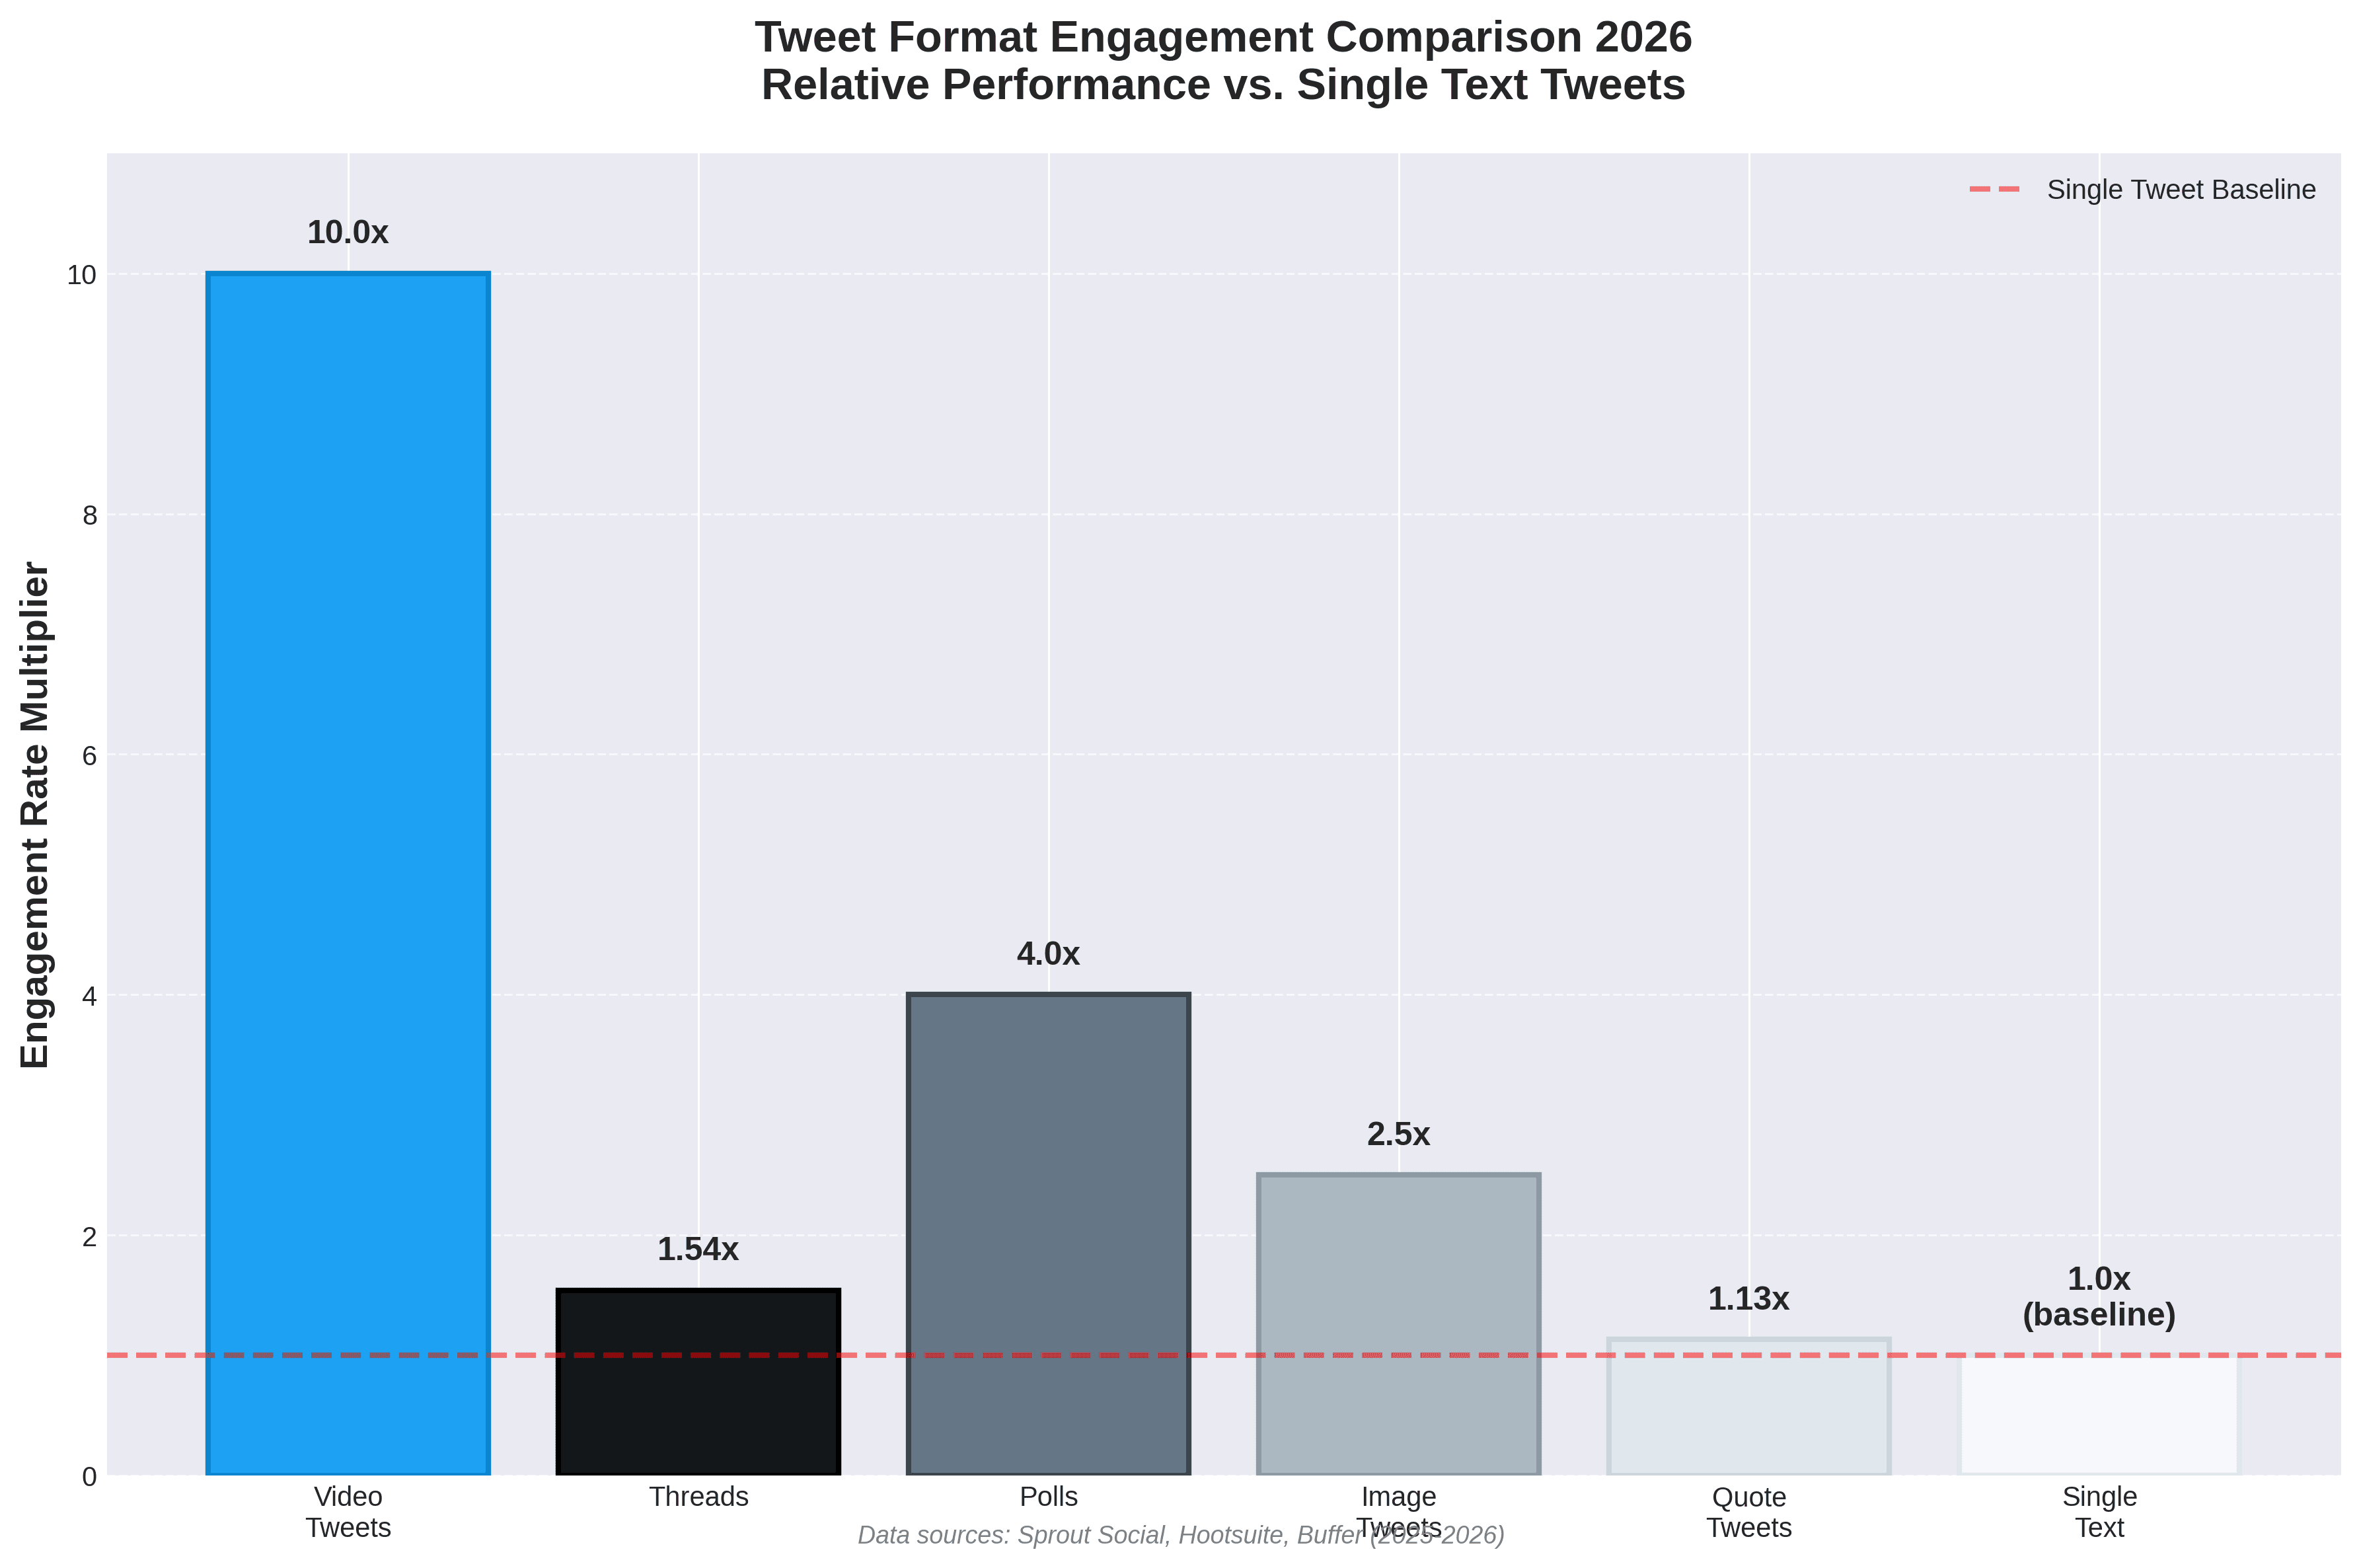
Video content receives substantial algorithmic boost, with video views increasing 40% year-over-year. Twitter's dedicated video tab creates opportunities for accounts embracing video formats. However, video completion rate matters more than raw views—short, engaging videos that people watch completely outperform longer content with high drop-off.
The algorithm also penalizes certain behaviors: excessive hashtags (more than 3 per tweet), engagement bait ("like if you agree" tactics), and repetitive content patterns. Authenticity and value creation consistently win over gaming the system.
Using Analytics to Improve Content
Data without action is just numbers on a screen. The real power of Twitter analytics emerges when you systematically apply insights to content strategy.
Start with content audits. Review your top 20 tweets by engagement rate over the past 90 days. Look for patterns: What formats dominate (threads, single tweets, videos)? What topics generate strongest response? What time of day performed best? These patterns become your content blueprint.
One often-overlooked metric: tweets by profile visits. This reveals which content makes people curious enough to click through to your profile—a critical precursor to follows. High-profile-visit tweets should inform your pinned tweet strategy and content themes.
For tweets with links, UTM parameters transform analytics from interesting to actionable. Google's Campaign URL Builder lets you tag links in tweets, then track performance in Google Analytics. A tweet might generate impressive likes but zero website visits—UTM tracking reveals this disconnect so you can adjust your call-to-action strategy.
Compare top-performing content against your "average" tweets. What elements distinguish them? Often, the difference lies in opening hooks, specificity of value proposition, or inclusion of visual elements. Systematically incorporate winning elements into more content.
Setting Up Your Analytics Dashboard
Effective Twitter performance tracking requires the right tools in the right configuration. The native Twitter analytics dashboard, now gated behind X Premium, provides basic metrics but lacks the analytical depth serious growth requires.
For comprehensive tracking, consider using third-party analytics tools that aggregate data across longer timeframes and provide advanced reporting. Tools like Hootsuite, Socialinsider, and specialized Twitter analytics platforms offer features the native dashboard doesn't: multi-month trend analysis, competitor benchmarking, content pillar performance tracking, and custom reporting.
Your analytics dashboard should surface key metrics at a glance: current engagement rate and trend direction, follower growth rate (weekly and monthly), top 5 tweets by engagement rate, CTR for link-containing tweets, and impressions trend over time.
Create custom views for different goals. If you're focused on thought leadership, prioritize reply counts and profile visits. For traffic generation, emphasize CTR and link clicks. For community building, track conversation rate (replies divided by total engagements).
Set up automated reports that deliver weekly performance summaries. Consistent review cycles keep you responsive to what's working. When you notice an uptick in engagement rate after posting certain content types, you can pivot quickly rather than discovering the insight weeks later.
Weekly Analytics Review Routine
Effective Twitter analytics requires consistent review, not sporadic deep dives. Establish a weekly routine that keeps you informed without overwhelming you with data.
Monday Morning (15 minutes): Review previous week's performance. Note your top 3 tweets by engagement rate, calculate weekly follower growth rate, and identify any unusual spikes or drops in key metrics.
Wednesday Check-In (10 minutes): Mid-week pulse check on current week's content performance. Are engagement rates trending up, down, or stable? Should you adjust your content plan for the remainder of the week?
Friday Analysis (20 minutes): Deeper dive into what worked and why. Analyze top performers to identify patterns, review CTR on any link-containing tweets, and note which content formats generated strongest response.
Monthly Deep Dive (60 minutes): Comprehensive performance review. Calculate monthly growth rate across all key metrics, conduct content audit of top 20 tweets, identify emerging trends or shifting audience preferences, and set goals for the coming month.
The key is consistency over intensity. Fifteen minutes of focused weekly analysis beats monthly marathons where you're overwhelmed by data and miss actionable patterns.
While understanding Twitter analytics is crucial, manually tracking and optimizing every metric becomes overwhelming as you scale content production. This is where tools like TweetBlink transform analytics from a tracking exercise into a growth engine.
TweetBlink's advanced analytics features provide insights that go beyond what Twitter's native dashboard offers. The platform tracks which tweet formats generate highest engagement for your specific audience, analyzing performance across question tweets, storytelling formats, educational content, and promotional posts. This format-level analysis lets you identify your highest-converting structures and replicate success.
The tone analysis feature is particularly powerful for understanding what resonates with your audience. By tracking engagement rates across different tones—professional, conversational, controversial, humorous—you discover which voice drives strongest response. Many creators are surprised to find their assumed "brand voice" underperforms compared to tones they rarely use.
TweetBlink's style analysis feature learns from your highest-performing content, identifying patterns in sentence structure, vocabulary, punctuation, and formatting that consistently drive engagement. The AI then applies these learned patterns to new content, ensuring your tweets maintain the stylistic elements your audience responds to.
The platform's historical tracking creates a complete archive of your Twitter journey. Beyond just storing old tweets, TweetBlink analyzes how your content evolution correlates with audience growth. You can pinpoint exactly when your engagement rate increased, which content shifts preceded follower growth, and which approaches didn't work so you avoid repeating mistakes.
Perhaps most valuable: TweetBlink's configuration reuse feature. When you identify a high-performing tweet, you can instantly apply that same format, tone, and targeting configuration to new ideas. This dramatically shortens the path from concept to optimized content, letting you spend less time configuring and more time creating.
Turning Data Into Actionable Insights
Raw analytics data becomes valuable only when translated into specific actions. Here's how to move from metrics to meaningful strategy changes.
When engagement rate drops below your baseline: Audit recent content for pattern changes. Did you shift topics? Change posting frequency? Adjust your tone? Often, engagement drops correlate with deviation from what your audience expects. Return to formats and topics that historically performed well.
When CTR declines despite stable impressions: Your hooks aren't converting views to clicks. Test different opening lines, experiment with curiosity gaps, and try leading with specific outcomes rather than general promises. A hook like "3 analytics mistakes costing you followers" outperforms "Important analytics tips" because it's specific and implies concrete value.
When follower growth stagnates or declines: Evaluate whether you're attracting your target audience. Growth for growth's sake is hollow. Would you rather have 10,000 followers with 0.5% engagement or 2,000 followers with 5% engagement? The second scenario generates more total interaction and signals stronger algorithmic favor. Focus on creating content for your ideal audience, not the widest possible audience.
When impressions grow but engagement stays flat: You're reaching more people who don't care about your content. This often happens when using trending hashtags unrelated to your niche. While impressions spike, you're attracting the wrong audience. Refocus on topics and hashtags directly relevant to your expertise.
Benchmark against yourself, not others. Your 2% engagement rate might underperform a competitor's 4%, but if you've grown from 0.8% to 2% over three months, you're on the right trajectory. Sustainable improvement trumps comparative positioning.
Common Analytics Mistakes to Avoid
Even experienced Twitter users fall into analytics traps that distort decision-making.
Mistake #1: Overvaluing follower count. An account with 50,000 followers and 0.5% engagement rate (250 interactions per tweet) has less influence than an account with 10,000 followers and 3% engagement (300 interactions). The algorithm rewards engagement density, not audience size. Focus on cultivating an engaged community over accumulating followers.
Mistake #2: Ignoring time-series trends. A single week's metrics reveal little. Three months of data reveals patterns. Engagement rates fluctuate naturally—what matters is whether your three-month moving average trends upward. Don't panic over weekly dips or get overconfident from weekly spikes.
Mistake #3: Comparing against inappropriate benchmarks. Sports-related accounts average 0.072% engagement rate while media accounts struggle at 0.009%. Your performance should benchmark against your industry and audience size, not overall platform averages. A local business with 2% engagement is crushing it; a global brand at 2% likely underperforms.
Mistake #4: Tracking metrics without strategic connection. Every metric you monitor should link to a specific goal. If your goal is thought leadership, profile visits matter. If your goal is traffic generation, CTR matters. If your goal is community building, reply counts matter. Tracking everything creates information overload without strategic clarity.
Mistake #5: Failing to act on insights. Analytics reveal opportunities, but only action creates growth. The most sophisticated dashboard is worthless if you don't adjust strategy based on what you learn. Set a rule: every analytics review session must produce at least one actionable change to test.
The Future of Twitter Analytics in 2026 and Beyond
Twitter analytics continues evolving as the platform itself transforms. Several trends are reshaping how creators track and optimize performance.
Predictive analytics powered by AI will become standard. Rather than just reporting what happened, analytics platforms will forecast performance based on historical patterns. "This tweet format typically generates 3-5% engagement for your audience at this time" becomes "Post this format at 2 PM Wednesday for predicted 4.2% engagement."
Cross-platform attribution will better connect Twitter activity to broader business outcomes. As tools improve at tracking customer journeys that start with a tweet and end with a purchase days later, you'll finally quantify Twitter's role in revenue generation beyond direct link clicks.
Privacy-first analytics will emerge as data regulations tighten. Aggregate insights will remain available, but granular user-level tracking will diminish. This shifts emphasis toward platform-provided analytics and first-party data collection through owned channels.
Real-time optimization will become more accessible. Currently, most creators review analytics retrospectively. Emerging tools will provide in-tweet-moment optimization suggestions: "Your hook could be stronger—try this alternative" or "This format underperforms for your audience—switch to thread format."
Video analytics will gain sophistication matching other content types. As video becomes central to Twitter strategy, detailed metrics around completion rates, engagement patterns, and audience retention will help creators optimize video content as rigorously as text tweets.
Conclusion
Twitter analytics in 2026 isn't about tracking everything—it's about tracking what matters. Engagement rate reveals content resonance. CTR measures conversion effectiveness. Follower growth rate indicates sustainable momentum. Impressions provide context for reach. Together, these metrics create a complete picture of your Twitter performance.
The gap between successful Twitter accounts and stagnant ones increasingly comes down to data literacy. Those who understand analytics, identify patterns, and systematically optimize based on insights will grow. Those who post randomly and hope for the best will plateau.
Start simple. Pick three metrics aligned with your goals and track them consistently for 30 days. Let patterns emerge. Apply insights. Measure results. As you develop analytical fluency, expand to more sophisticated tracking.
Tools like TweetBlink accelerate this journey by automating the heavy lifting of analytics tracking, pattern recognition, and optimization application. But the tool is only as effective as your commitment to data-driven growth.
Your Twitter analytics story isn't written by the platform's algorithm—it's written by your willingness to learn from data and adapt accordingly. The metrics are there. The insights are available. The question is: will you use them?
Key Takeaways
Engagement rate is the most important Twitter metric—prioritize quality of interaction over vanity metrics like follower count
Track impressions alongside engagement to understand both reach and resonance
Weekly analytics reviews create consistent improvement without analysis paralysis
Use UTM parameters to connect Twitter activity to broader business outcomes
The Twitter algorithm in 2026 rewards sustained engagement and video content completion
Benchmark against your own historical performance, not generic platform averages
Tools like TweetBlink transform analytics from tracking exercise to growth engine
Every metric you monitor should connect directly to a specific strategic goal
Ready to stop guessing and start growing? TweetBlink provides the analytics insights and content optimization tools you need to transform your Twitter presence. Try it today and see what data-driven growth looks like.